
TL;DR
A data grid is an interactive interface for working with records in rows and columns. Choose capabilities around user tasks, not the longest feature list. Establish whether the browser or server owns filtering, sorting, and pagination. Treat virtualization as a separate rendering decision, and evaluate keyboard access, editing recovery, selection scope, and responsive behavior before committing.
A dashboard grid can be a customer directory, a billing workbench, or a planning surface. Those screens may look similar while requiring different behavior.
We recommend starting with the work someone must finish: find an overdue account, correct a value, compare records, or assign an owner. This guide translates those jobs into requirements without ranking libraries or turning the decision into an implementation tutorial.
Table of contents
- What is a data grid?
- Translate dashboard workflows into grid capabilities
- Decide where filtering, sorting, and pagination happen
- Make API query state part of the grid contract
- Virtualization solves a different problem
- Keyboard accessibility is part of the interaction model
- Evaluate failure states and small screens together
- Prioritize with realistic workflow briefs
- A concise data grid requirements checklist
- FAQ
- Evaluate one complete workflow before choosing
- Sources
- Recommended Reads
What is a data grid?
An application data grid presents structured records as rows, with fields represented by columns, and adds tools for interacting with that information. Depending on the component and configuration, those tools can include filtering, sorting, selection, editing, grouping, and export. These are possible capabilities, not a universal package guaranteed by the name. Handsontable’s explanation of JavaScript data grids distinguishes interfaces centered on exploring data from those centered on entering and changing it.
A grid is not the database behind the screen. Decide separately where records are fetched, how changes are validated, and what confirms that a save succeeded.
Data grid versus data table
A conventional table can contain sortable headers, links, buttons, and checkboxes. None automatically requires spreadsheet-style cell navigation. W3C’s table pattern explicitly allows interactive controls inside a table and recommends native HTML tables where possible.
An interactive ARIA grid has a different focus contract: it is a composite widget whose internal navigation the author must manage. The W3C grid pattern describes that behavior.
Ask whether users need ordinary document navigation with individual controls, or coordinated movement across cells. A component’s marketing label does not settle its accessibility semantics.
Translate dashboard workflows into grid capabilities
Find and inspect the right records
For customer operations, “find overdue enterprise accounts assigned to me” is more informative than “needs filtering.” It identifies status, account-tier, and owner filters, plus a visible way to revise the query.
Specify behavior alongside the controls. Does searching an account name also search hidden notes? Is an empty field different from zero? Does a date filter mean a calendar day or an exact timestamp? Resolve these questions before comparing filter menus.
Make applied filters visible and explain the result count’s scope. Users should not have to reopen several menus to understand why a record is missing.
For inspection, consider readable formatting, column widths, and keeping the record identifier visible while scrolling horizontally. Add column hiding or saved views when users repeatedly need different perspectives on the same records, not merely because a demo includes them.
Change data without losing confidence
Inline editing is useful when a task involves frequent, small changes. A separate form may be clearer when a change needs explanation, dependent fields, or a review step.
Before requesting an editor, decide when a change commits: leaving a cell, saving a row, or submitting a batch. Specify how invalid input appears, how someone cancels, and what remains after the server rejects a change.
For collaborative workflows, include a conflict scenario in the evaluation. Ask what should happen if another person changes the same record before a pending save completes. A working cell editor should not be treated as evidence of a complete persistence strategy.
Also distinguish the values being displayed, edited, and saved. A formatted currency value may be easy to read but insufficient for reviewing the exact amount being submitted.
Select, export, and act on rows
Selection needs an explicit scope. “Select all” could mean visible rows, the current page, or every record matching the query. Label the intended meaning before exposing a bulk action.
We recommend tracking selected records by stable identity rather than their display position. Decide whether selection survives filtering and whether hidden selections remain eligible for an action.
Export has the same scope problem. Specify whether users receive the displayed page, selected records, or the full filtered result, and whether hidden columns belong in the output. Make these acceptance criteria rather than one checkbox labeled “export support.”
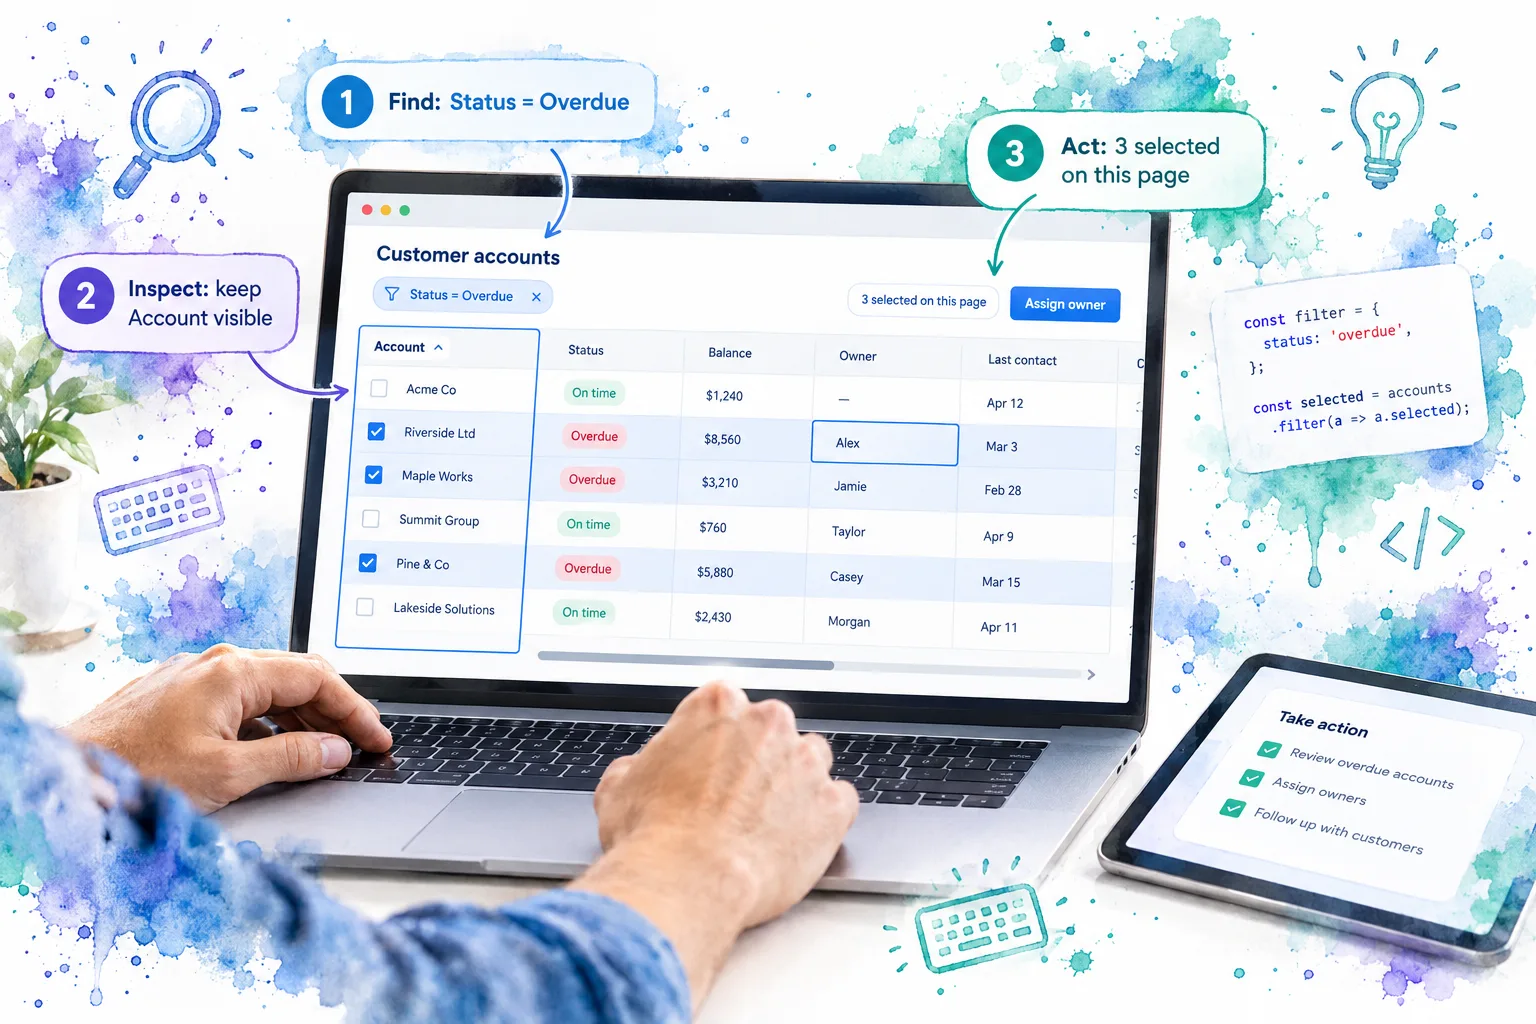
Conceptual workflow: the filter defines the records, the persistent identifier supports inspection, and the selection summary defines the action’s scope. This illustration is not a product screenshot.
Decide where filtering, sorting, and pagination happen
Client-side and server-side processing describe who operates on records. Pagination describes how users move through a result. Keep those decisions aligned.
With client-side processing, the browser works on the complete loaded dataset and divides it into pages if needed. Evaluate transfer size, browser memory, query responsiveness, and cell complexity.
With server-side processing, the application sends query state to an API and displays its returned result window. Evaluate API capabilities, response time, loading states, and consistency across query changes.
Client-side processing can suit a bounded dataset that is reasonable to load completely. There is no universal row-count cutoff: record size, column count, rendering complexity, and device constraints matter. TanStack Table’s v8 pagination guide discusses these considerations.
Choose server-side processing when the complete dataset should not be loaded into the browser or when the backend must perform the authoritative query.
Avoid fetching one server page and presenting a local sort as though it sorted the whole collection. TanStack’s v8 sorting guide warns that client-side sorting with server-side pagination or filtering sorts only loaded data.
For example, sorting 50 loaded accounts by revenue does not identify the highest-revenue accounts among 50,000 records. Those numbers illustrate scope, not a performance threshold.
Make API query state part of the grid contract
For a server-backed screen, we recommend one application-owned description of the current query: search text, filters, sort rules, and the requested page or cursor.
Define the transitions as well as the fields:
- A filter change returns navigation to a valid starting point.
- A sort change invalidates any cursor tied to the previous ordering.
- Older responses cannot replace results for a newer query.
- Counts and bulk actions describe the same query as the displayed records.
- Shareable views preserve meaningful query state, not transient interface details.
Imagine someone filters to “overdue,” then immediately switches to “paid.” The application should not display a slower overdue response beneath a paid filter chip. Include that sequence in the proof of concept.
Distinguish known totals from unknown ones. If an API returns only a next-page signal, design navigation around that information instead of inventing a last page. The TanStack pagination guide explains why a table cannot know the backend’s total without receiving it.
Virtualization solves a different problem
Virtualization renders a moving window of rows or columns instead of mounting the entire available collection. Vue’s performance guidance describes rendering items in or near the viewport to reduce DOM workload.
It does not, by itself, reduce records transferred from an API or perform a global server query. A client-side dataset can be virtualized, and a server-backed grid can virtualize loaded records. Fetching and rendering remain separate responsibilities.
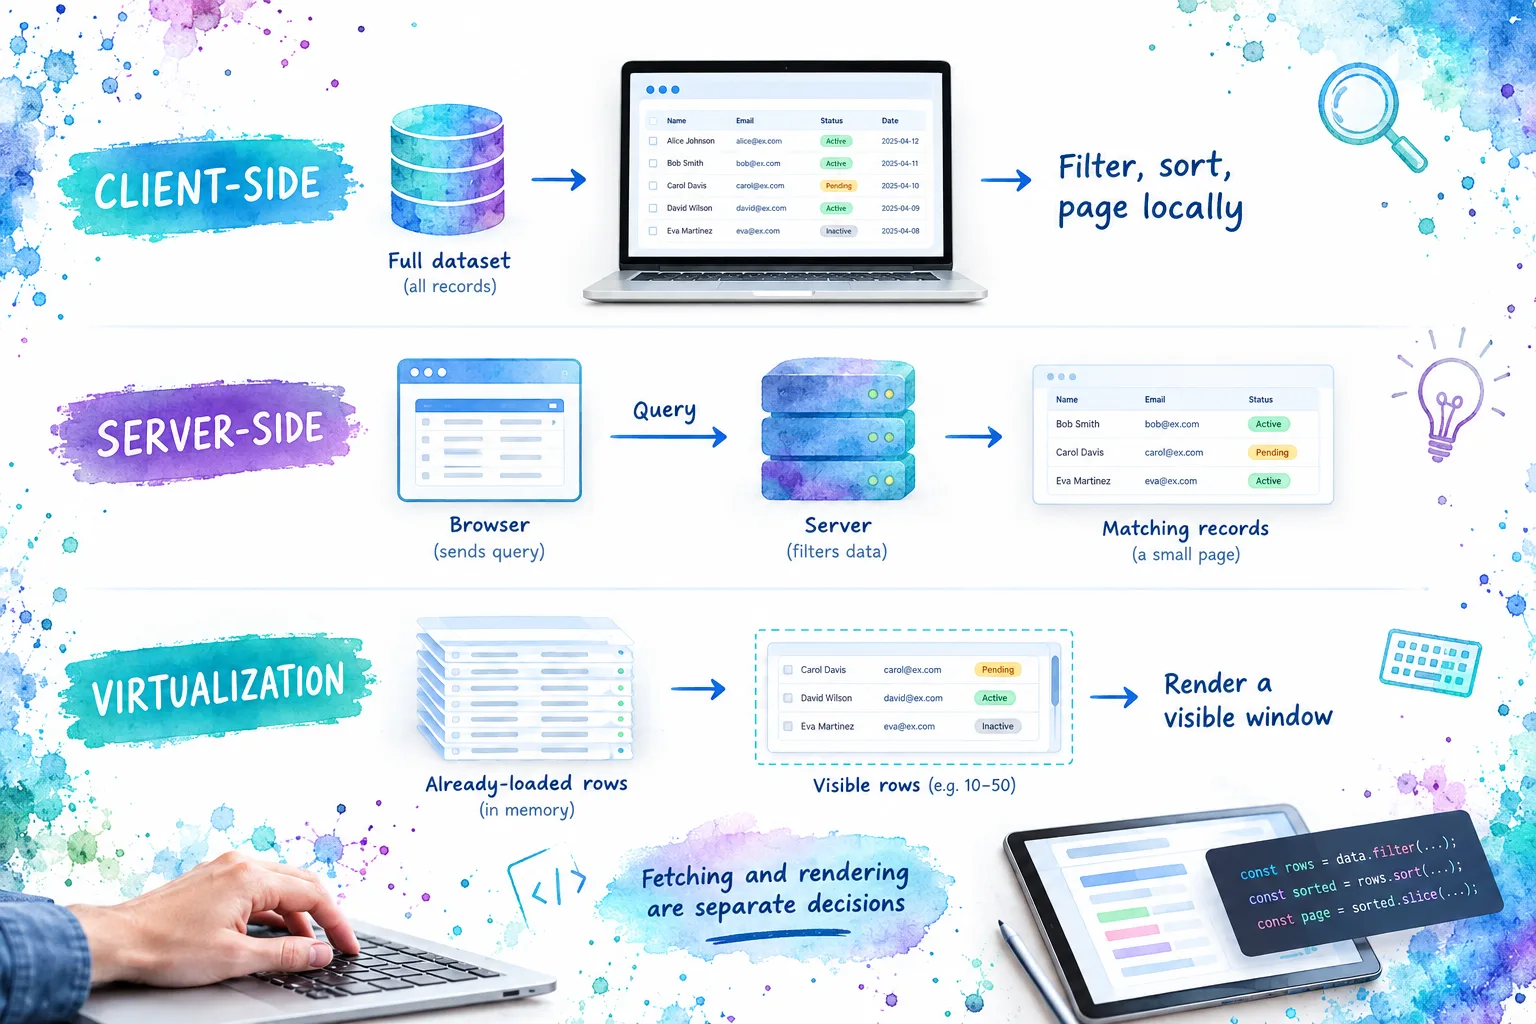
Choose query ownership first. Then decide whether the loaded records need a smaller rendered window.
Profile the actual bottleneck. Evaluate download size, query latency, memory, scrolling, and custom-cell costs separately. Test expanded details, menus, validation messages, and changing row heights rather than relying on an empty-cell demo. A small rendered window is not proof that the complete workflow is fast.
Keyboard accessibility is part of the interaction model
For an ARIA grid, evaluate navigation rather than just whether cells can receive focus. W3C’s grid guidance describes managed internal focus, arrow-key movement, and conventions for reaching cells and controls.
Ask a reviewer to complete a realistic task without a pointer: apply a filter, reach a record, open its action menu, make or cancel an edit, and leave the grid. Check visible focus and where it returns after menus close or results change.
For editable cells, define when arrow keys move between cells and when they operate inside an editor. With virtualized rows, test what happens when the active record leaves the rendered window. Keep selection and keyboard focus distinguishable.
For background, Google Chrome Developers’ Roving tabindex episode explains a useful focus technique. It is not a complete grid implementation or an accessibility certification.
Google’s guide to controlling focus with tabindex provides written context. Test the finished screen with supported browsers and assistive technologies; documentation cannot validate your custom editors and menus for you.
Evaluate failure states and small screens together
A requirements document should explain what people see when the happy path breaks.
Loading and refresh: Distinguish the first load from refreshing existing records. If old records remain visible, make their status clear and decide which actions remain available.
Empty and error: Separate “no records exist” from “no records match these filters.” Offer a relevant action, such as clearing filters or retrying. A failed request should not masquerade as an empty result.
Failed saves: Preserve enough context to explain what was rejected. Specify whether the attempted value remains available and how unsaved changes are identified.
On narrow screens, keep essential identifiers and actions accessible. Use a deliberate horizontally scrollable region when column relationships matter, or provide secondary details elsewhere when that improves the task.
W3C’s Reflow guidance allows an exception for content whose meaning or use requires a two-dimensional layout, including data tables. It does not exempt every surrounding control or remove the need for readable cell content. Test zoom, filter panels, menus, and action bars alongside the table body.
Prioritize with realistic workflow briefs
We recommend separating release requirements from capabilities that merely look useful in a demo.
Customer support: find and update one account. Prioritize reliable search, understandable filters, a detail route, and a recoverable owner-update flow. A conventional table with accessible controls may suffice. Defer spreadsheet features unless the task needs them.
Finance operations: correct a batch of records. Prioritize keyboard interaction, typed editors, validation, explicit batch-save behavior, and partial-failure recovery. Prove that users can identify which changes succeeded before investing in elaborate column customization.
Revenue analysis: inspect and share a segment. Prioritize query-wide filtering and sorting, shareable state, understandable counts, and explicit export scope. Add grouping or aggregation when analysis requires it, and define whether totals describe the page or the complete result.
Choose the smallest feature set that completes the workflow correctly. Evaluate candidates using the same records and tasks, including realistic delays and the cell content you expect to ship. Record gaps as application work rather than silently assuming the library handles them.
A concise data grid requirements checklist
Before choosing a component, write down:
- Primary job: The user task and how success will be judged.
- Data shape: Expected volume, column count, value types, and growth assumptions.
- Query ownership: Browser or server, with consistent filtering, sorting, and pagination.
- Editing: Commit boundaries, validation, cancellation, failed saves, and conflicts.
- Selection and export: Scope, persistence across queries, and eligible actions.
- Keyboard access: Navigation, editors, menus, focus recovery, and supported assistive technology.
- Responsive behavior: Essential columns, scroll ownership, zoom, and reachable actions.
- UI states: Initial loading, refresh, no results, errors, retry, and partial failure.
- Evaluation evidence: Results from the same representative workflow on each candidate.
FAQ
Does every dashboard need a data grid?
No. Start with a conventional table when reading records and following links satisfy the task. Add coordinated cell navigation or editing when the workflow justifies it. W3C’s table pattern permits interactive controls without making the table a composite widget.
Is infinite scrolling the same as virtualization?
No. Infinite scrolling describes loading additional records as someone progresses. Virtualization limits which available items are rendered. They can be combined, but loading and rendering remain distinct. See Vue’s virtualization guidance for the rendering principle.
Does an editable grid save changes automatically?
Do not assume it does. Verify the component contract and your persistence flow. For example, our DomDataGrid documentation states that the grid reports user changes while leaving saving to the application.
Evaluate one complete workflow before choosing
Start with one record-finding task, one meaningful action, and the failure state most likely to interrupt it. We recommend proving that complete path before expanding the feature list.
Explore our data grid documentation and examples to inspect a concrete Vue interface. Use your checklist to evaluate both the interaction and the application’s responsibilities, rather than assuming an attractive grid resolves the surrounding data workflow.
Sources
- Handsontable: What is a JavaScript Data Grid?
- W3C: Table Pattern
- W3C: Grid Pattern
- TanStack Table v8: Pagination Guide
- TanStack Table v8: Sorting Guide
- Vue: Performance
- Google web.dev: Control focus with tabindex
- W3C: Understanding Reflow
- DOM Studio: Vue Data Grid with Filtering
Recommended Reads
- 6 Vue Data Grid Options for Production Apps: Features, Control, and Fit: Compare options after defining your requirements.
- Virtualized Table in Vue: Build Fast Rows Without Losing Grid Interactions: Explore rendering windows, record identity, and focus.
- Vue Dashboard Components: How to Build a Production-Ready Dashboard: Connect your grid to the surrounding architecture.