Lighthouse testing turns subjective UI opinions into measurable quality checks. Run it consistently, and your team can catch performance drifts, accessibility gaps, and best-practice regressions before they ever reach production.
Table of Contents
- Build Confidence Through Measurable UI Standards
- Make Audits Part of Normal Development
- Create a Repeatable Local Baseline
- Enforce Budgets in CI
- Understand Each Audit Category
- Prioritise Fixes Without Chasing Noise
- Fix the Largest Sources of Delay
- Turn Failures Into Continuous Checks
- Test States and Interactions
- Scale Checks by Risk
- How Should Vite and Webpack Projects Run Audits?
- Why Do Mobile and Desktop Results Differ?
- How Can Teams Handle Accessibility False Positives?
Build Confidence Through Measurable UI Standards
A polished interface is not automatically a dependable one. A button may look correct while failing keyboard navigation, loading slowly, or exposing unclear information to screen readers. Lighthouse testing gives those concerns a repeatable assessment instead of leaving them to ad-hoc review.
That matters especially for shared component libraries. DOM Studio components need predictable behaviour wherever Vue teams place them, whether that is a marketing page or a complex application shell. Audits provide evidence that each release still meets agreed standards.
Treat Lighthouse results as engineering feedback, not a pass-or-fail ceremony. The useful question is what the report helps your team improve next.
A strong quality foundation covers several areas:
- Performance — loading and responsiveness signals, including Largest Contentful Paint and interaction readiness.
- Accessibility — semantic structure, focus behaviour, and colour contrast.
- Best practices — flags for risky implementation patterns.
- SEO — discoverability fundamentals.
- Traceability — a record of when tests ran and what changed afterwards.
This approach works a lot like regulated infrastructure inspections. Regular, documented checks create a history your team can review and compare, rather than relying on someone’s memory of how a page behaved last month.
Make Audits Part of Normal Development
Run a local audit while building a component, then repeat it in CI when the change enters a pull request. That rhythm catches problems while the surrounding code is still familiar and long before a release makes remediation expensive.
For Vue teams, accessible primitives reduce the amount of behaviour developers must recreate manually. But they do not remove the need to test real usage. Always check labels, keyboard flows, responsive layouts, and content-heavy states in context.
You might also read this guide to design system architecture before defining your library’s quality rules. Start with a small, documented baseline, then raise it as your components and product mature.
A solid Lighthouse testing workflow pairs quick local feedback with consistent pull-request checks. Use Chrome DevTools to audit a page while you’re developing; the CLI lets you repeat the same test against a defined URL. Keep your browser profile clean — extensions can skew local results — and bear in mind that CPU, Chrome version, location, and throttling settings all influence scores. DebugBear has a good breakdown of why Lighthouse and PageSpeed Insights results differ.
The infographic below shows how audits shift from subjective UI opinions to documented, accessible, predictable, production-ready standards.
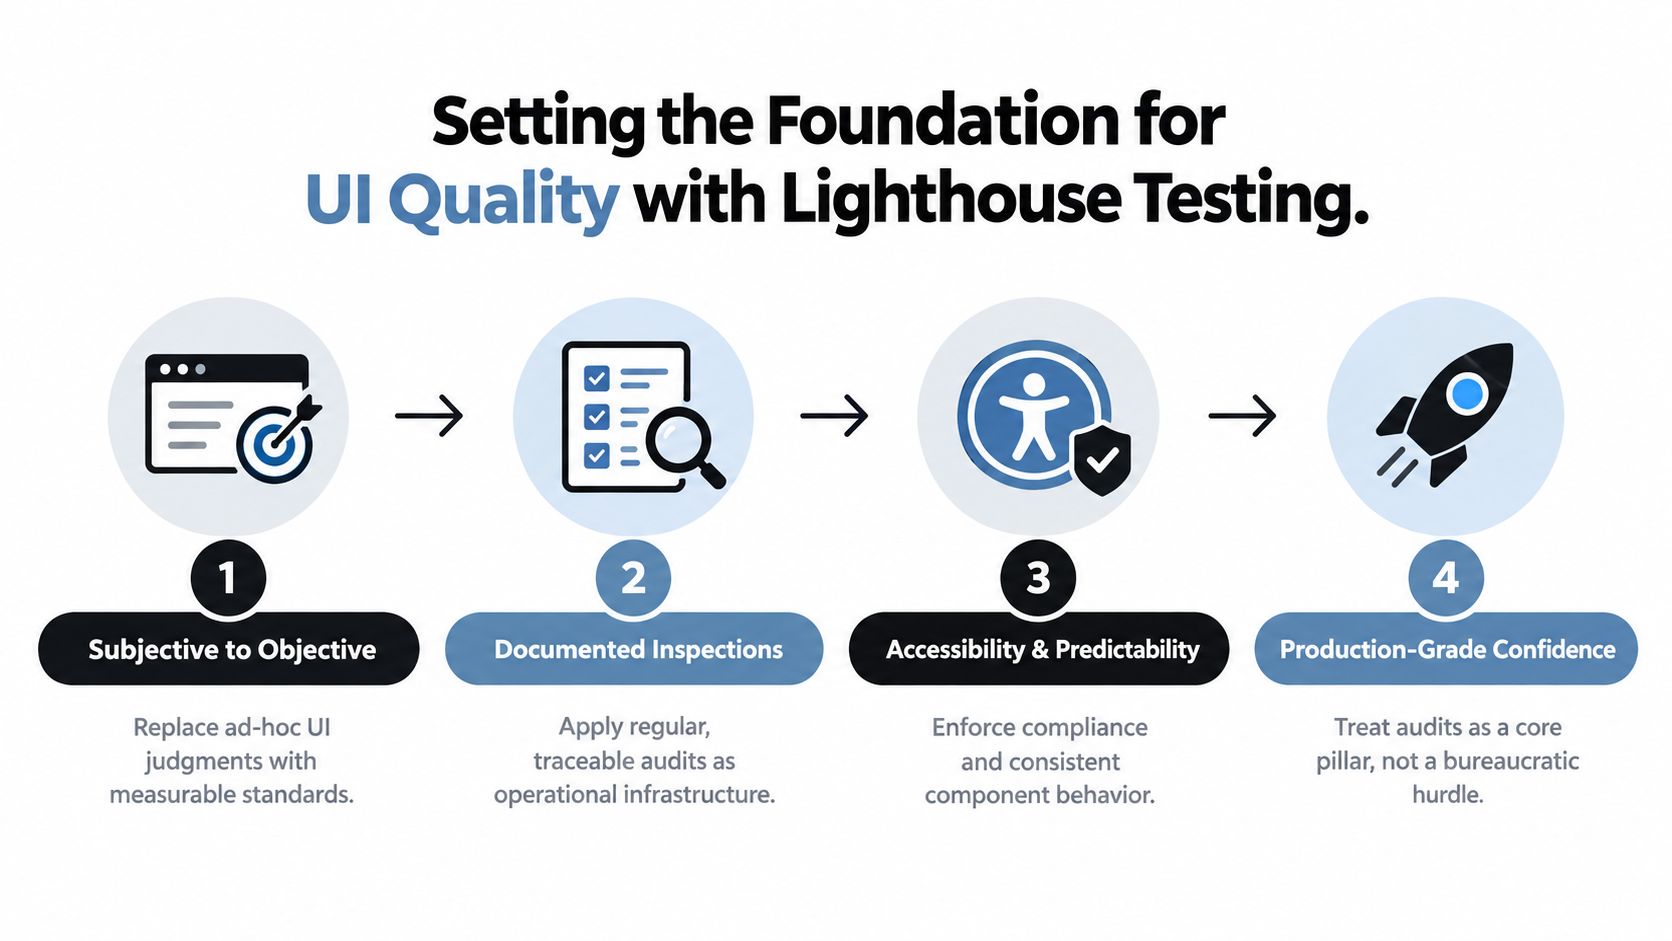
The takeaway is straightforward: quality checks become dependable when they run regularly against agreed thresholds, rather than relying on a last-minute manual review.
Create a Repeatable Local Baseline
Before touching any code, record the tested URL, device mode, throttling method, Lighthouse version, and the scores that matter. Run the audit three times and look for patterns instead of reacting to a single noisy result.
For a Vue component, test a realistic route that includes the component, then inspect its isolated states separately. DOM Studio’s headless primitives can help preserve ARIA roles, focus handling, and keyboard behaviour, but the surrounding application still needs its own checks.
Set explicit guardrails for:
- Performance, covering Core Web Vitals and JavaScript execution time.
- Accessibility, with a minimum score your team won’t waive without discussion.
- Best practices, including browser compatibility and security recommendations.
- SEO, where public routes need crawlable, meaningful content.
Enforce Budgets in CI
Run Lighthouse through GitHub Actions on every pull request that touches shared UI or critical routes. Fail the check when a performance budget, accessibility threshold, or best-practice minimum drops below your baseline, then publish the report as an artefact for review.
Keep CI runs stable by pinning tool versions, testing the same route each time, and avoiding unrelated network dependencies. Tree-shaking helps here — DOM Studio modules average under 2 kb gzipped, though importing unnecessary dependencies can still blow past your budget.
A useful gate blocks regressions, not experimentation. Review exceptions explicitly and attach a follow-up issue.
Finally, pair Lighthouse with visual regression testing for UI changes, so functional, visual, accessibility, and performance failures all get reviewed together.
A Lighthouse report only really earns its keep once you stop fixating on that headline number and start digging into what sits underneath. Consistency matters enormously here — run your tests on the same device profile, with the same throttling settings, browser version, and location each time. Even seemingly minor things like CPU speed, a Chrome update, a stray extension, or how the network is simulated can shift results enough to send you chasing ghosts. DebugBear has a solid breakdown of why Lighthouse and PageSpeed Insights sometimes disagree, which is worth bookmarking.

Understand Each Audit Category
The real value of Lighthouse’s categories is that they let you connect warnings to actual user impact, rather than treating every flagged item as equally urgent.
| Audit Category | Primary Focus | Key Metrics |
|---|---|---|
| Performance | Loading and responsiveness | LCP, CLS, TBT, FCP |
| Accessibility | Inclusive interaction | Contrast, names, focus, ARIA |
| Best Practices | Safe implementation | HTTPS, browser errors, APIs |
| SEO | Search visibility | Crawlability, metadata, mobile readiness |
| PWA | App-like reliability | Installability, offline behaviour, service workers |
Performance tends to deserve first attention when a page shows a sluggish Largest Contentful Paint, excessive Total Blocking Time, or noticeable layout shifts. Open the Opportunities section and look at the estimated savings — they often point you straight to the culprit. Unused JavaScript, for instance, frequently traces back to an oversized Vue route or an import that’s defeating tree-shaking.
Accessibility findings catch things that visual review simply cannot. For a DOM Studio component, check that the rendered element carries the correct WAI-ARIA role, has a meaningful accessible name, and shows a visible focus indicator. Then try operating it entirely without a mouse — open menus, navigate through listboxes, close dialogs with Escape, and reach every control using Tab alone.
A passing accessibility score does not replace testing with a keyboard and screen reader, especially when components change state dynamically.
Prioritise Fixes Without Chasing Noise
Not every warning deserves the same urgency. Work through them in roughly this order:
- Fix missing labels, broken focus management, and insufficient colour contrast first — these affect real people immediately.
- Tackle render-blocking resources and unnecessary JavaScript next, since they slow down every visitor.
- Review SEO and PWA recommendations based on what the route is actually meant to do.
- Log low-impact diagnostics as planned work rather than treating them as emergencies.
Best Practices audits often surface console errors, mixed-content issues, or deprecated APIs that you might otherwise overlook. SEO checks flag missing titles, absent meta descriptions, or links that aren’t crawlable. PWA audits only matter if your application genuinely promises installable or offline behaviour — otherwise they’re noise.
When a result looks implausible, compare the report’s observed metrics against the simulated values. A single low score is a clue, not a verdict. Reproduce the issue, pin down the responsible resource or interaction, fix it, and rerun your Lighthouse testing before adjusting your budget.
Clear budgets turn Lighthouse testing into an actual engineering agreement that teams can stick to. Set limits for Largest Contentful Paint, Total Blocking Time, and Cumulative Layout Shift, then record them beside the route or component they protect. A practical baseline might target LCP below 2.5 seconds, TBT below 200 milliseconds, and CLS below 0.1, while recognising that Lighthouse lab results vary by device, CPU, throttling, and Chrome version.
Run the same configuration locally and in CI. Three repeated runs reveal whether a failure is consistent, and pinned versions make comparisons useful. Compare observed metrics with simulated values before changing code, because network simulations can produce misleading results. DebugBear explains why Lighthouse and PageSpeed Insights results differ.
Fix the Largest Sources of Delay
Start with the opportunity offering the clearest user benefit. If a hero image delays LCP, serve an appropriately sized WebP or AVIF file, preload only that critical image, and reserve its dimensions to prevent layout movement.
For JavaScript warnings, remove unused packages, split route-specific code, and defer features that users do not need immediately. DOM Studio’s headless primitives average under 2 kb gzipped, which supports tight budgets, but importing whole libraries or adding heavy dependencies can erase that advantage.
Use browser caching for stable assets with fingerprinted filenames. Keep critical CSS small, avoid loading every font weight, and postpone analytics until the main content is usable.
Fix the request that blocks meaningful content first, not the warning with the most dramatic wording.
Turn Failures Into Continuous Checks
A CI budget should identify the route, metric, current value, threshold, and likely owner. For example, a checkout regression might trigger a pull-request comment when TBT rises above 200 milliseconds, while an accessibility failure blocks merging immediately.
Core Web Vitals are central Lighthouse metrics, and AutoSEO tools for LCP offers practical guidance for improving LCP, INP, and CLS. Review reports weekly, track trends, and create follow-up issues for accepted exceptions.
For Vue components, audit isolated states and realistic pages. Test loading, empty, error, and content-heavy variants, because inefficient loading sequences often appear only outside the default story. Keep budgets visible, rerun Lighthouse after each fix, and treat monitoring as part of delivery rather than a final release checkbox.
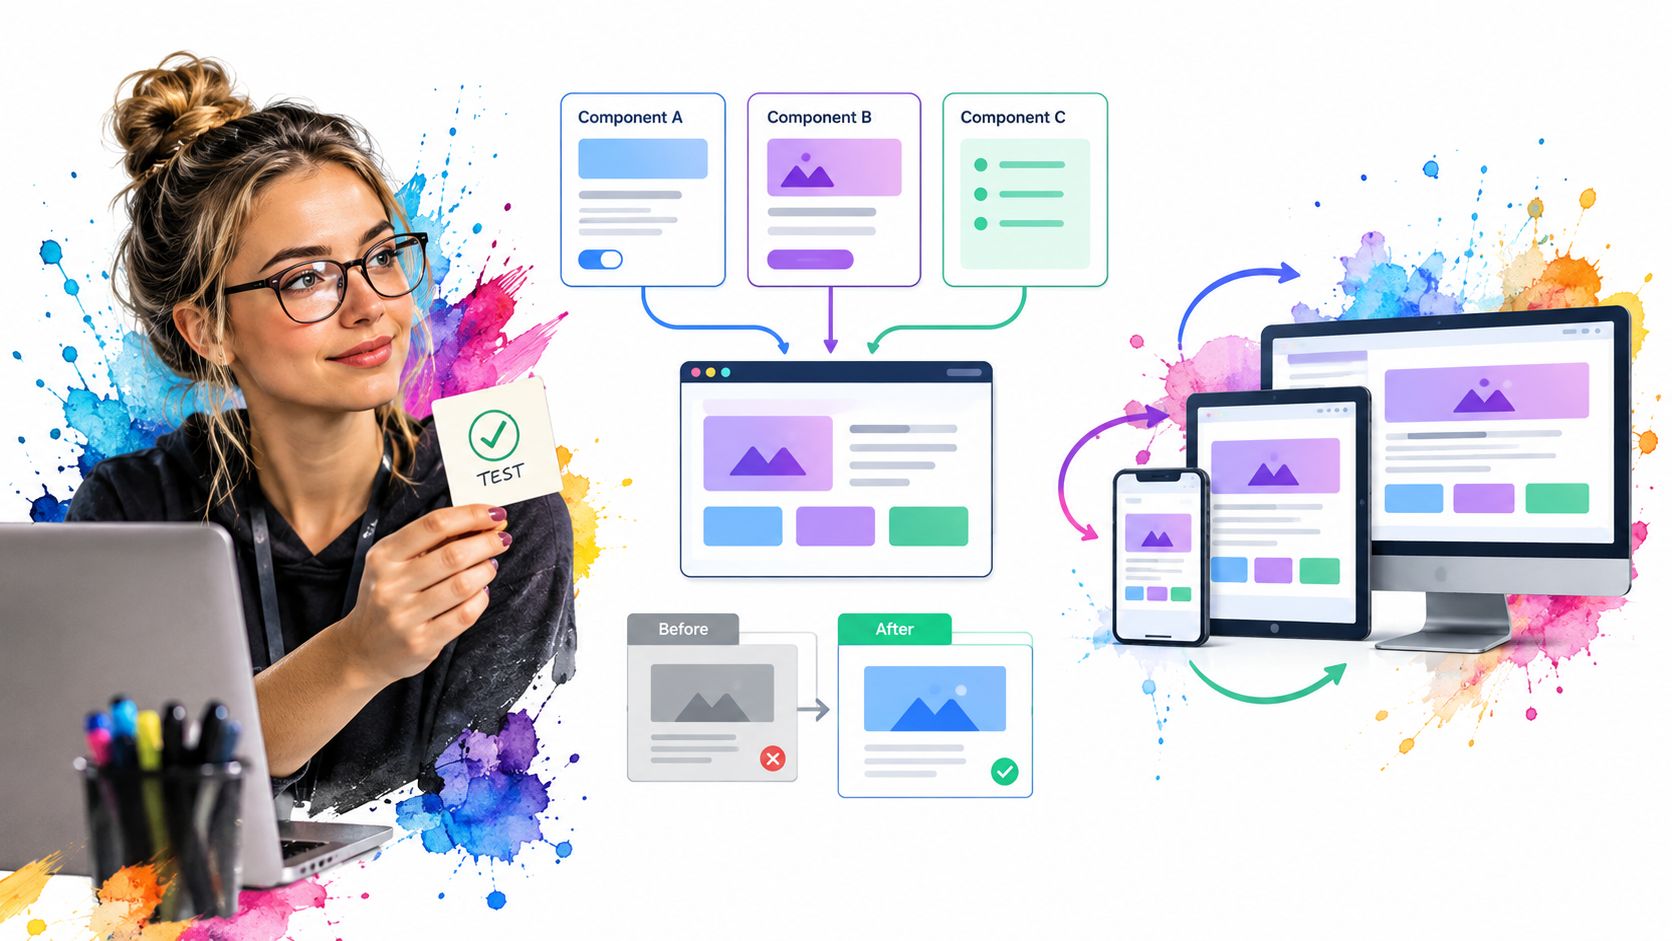
Lighthouse testing gets far more valuable once you move beyond the homepage and start examining components in isolation alongside the routes they actually live in. A dialog might score perfectly on its own, yet break focus flow, load duplicate JavaScript, or shift layout the moment real content lands on the page.
Test States and Interactions
Build a small test matrix for every shared component. It does not need to be elaborate, but it should cover the conditions you will encounter in production:
- States: loading, empty, error, disabled, and content-heavy variations.
- Interactions: keyboard navigation, focus return, Escape handling, and pointer use.
- Viewports: mobile, desktop, zoomed text, and reduced-motion preferences.
- Contexts: a standalone story plus a production-like page with routing and data.
Try testing a DOM Studio listbox by itself, then slot it next to a filter panel and a modal. Pay attention to whether focus stays visible, labels remain unique, and opening one control does not introduce unexpected scrolling elsewhere.
A component is ready to merge only when its behaviour, appearance, and page-level performance remain reliable together.
Pair Lighthouse with visual regression snapshots. A changed font, missing focus ring, or altered modal position may not trigger a dramatic audit failure, yet each one can still damage usability in ways scores alone will not catch. Read this guide to component testing in Vue for a practical way to structure isolated and integrated checks.
Scale Checks by Risk
Not every component warrants the same inspection frequency. Running automated Lighthouse checks on every pull request makes sense for the whole library, but deeper manual reviews should focus on high-risk changes:
- Audit dialogs, menus, comboboxes, and navigation whenever interaction patterns change.
- Profile components that introduce new scripts, images, animations, or third-party packages.
- Repeat keyboard and screen-reader checks before a major release, even if nothing appears to have changed.
- Revisit low-risk static components when their dependencies or shared styles update.
Record the route, viewport, Lighthouse version, and threshold alongside every result. Without that context, teams waste hours chasing score variations caused by different browsers, CPUs, or throttling settings rather than genuine regressions.
For larger libraries, make quality gates explicit: accessibility must not regress, visual snapshots require approval, and performance budgets must pass before merging. That combination lets automation handle repetitive checks while engineers focus on states and interactions that machines cannot judge reliably.
How Should Vite and Webpack Projects Run Audits?
With Vite, always build the production bundle before testing. Serve that output locally to surface problems the dev server quietly masks, things like unminified scripts, missing code splits, or asset loading behaviour that only appears once everything’s bundled.
Webpack projects work the same way. Run Lighthouse against a production-like route, not the hot-reloading dev server. And whatever configuration you use locally, mirror it exactly in CI. Consistency here matters more than most teams realise.
A few things that have saved me headaches:
- Pin Lighthouse and Chrome versions in your automation pipeline. A browser update can shift scores by five to ten points without a single code change.
- Test identical routes, viewport sizes, and throttling profiles across environments. If local runs use a MacBook on Wi-Fi and CI runs on a throttled container, the numbers won’t line up.
- Run tests three or four times locally, then compare the metric ranges rather than chasing a single score. Lighthouse variance is real.
- Store reports as pull-request artefacts. When a score drops on staging, being able to open the archived HTML report from last week is invaluable.
Why Do Mobile and Desktop Results Differ?
Mobile audits apply a 4x CPU slowdown and simulate a slower network connection, so JavaScript-heavy Vue pages almost always show worse Total Blocking Time and Largest Contentful Paint compared to desktop. The desktop score can look fine while someone on a mid-range Android phone is staring at a blank screen.
Treat mobile as your primary quality gate for any public route. Use desktop results to catch layout issues, hover interactions, or desktop-specific scripts that mobile testing skips. When the two reports seem to disagree, check the raw observed metrics and test conditions before changing anything in the code.
DebugBear has a solid breakdown of why Lighthouse and PageSpeed Insights numbers can diverge, even for the same URL. It’s worth reading if your monitoring tools show conflicting scores.
How Can Teams Handle Accessibility False Positives?
Start by reproducing the warning yourself. Walk through the page with keyboard navigation and open it in a screen reader. A surprising number of flagged issues turn out to be incomplete page states, test fixtures that don’t render the final markup, or elements that are intentionally hidden until a user interacts with them.
If the warning holds up, verify the rendered DOM carefully, check the accessible name, role, focus order, and visibility. Document any accepted exception with a clear reason and an owner rather than just switching the rule off. Audit settings should live in version control, and exceptions should get reviewed quarterly.
Vue component libraries using DOM Studio report average bundle sizes under 2 kb gzipped with headless primitives, supporting tighter Core Web Vitals budgets.
Keep audit settings versioned, review exceptions quarterly, and use community issue trackers when a warning repeatedly contradicts real behaviour.
DOM Studio helps Vue teams build accessible, small interfaces. Explore DOM Studio and start your next Lighthouse testing workflow with production-ready primitives.