
Most React Data Grid advice starts with the longest feature list and works backwards to a licence. That’s the wrong order for production work. A grid that scrolls smoothly in a demo can still fail a keyboard user, force a paid tier six months after launch, or load personal data into browser memory that should’ve stayed on the server.
Start instead with three gates: virtualisation behaviour, accessibility, and licence triggers. Test those before you fall in love with an API. Features matter, but they only count if the grid survives real row counts, real assistive technology, and the product roadmap your team plans to ship.
Table of Contents
- Which React Data Grid to Shortlist First
- How the Main React Data Grid Libraries Are Built
- Performance and Virtualisation Trade-offs at Scale
- Editing, Filtering and Export Features Compared
- Accessibility Requirements and How to Test a Grid
- Bundle Size, Licensing and Integration Costs
- Confirm Your Shortlist Before You Commit
Which React Data Grid to Shortlist First
The table below sorts five common choices by the decisions you’ll make first. The Licence column shows whether a paid tier may be needed, Virtualisation shows how each React Data Grid behaves with thousands of rows, and Best fit names the project type each library suits. Confirm each cell against current vendor documentation before publishing a decision internally.
| Library | Licence | Virtualisation | Best fit |
|---|---|---|---|
| AG Grid | MIT Community, commercial Enterprise | Yes, rows and columns | Complex enterprise grids with grouping and export |
| MUI X Data Grid | MIT Community, commercial Pro and Premium | Yes, rows and columns | Teams already building with MUI components |
| react-data-grid | MIT | Yes, rows and columns | Lightweight grids with simpler feature needs |
| TanStack Table | MIT, headless | No, add a virtualiser yourself | Teams that want full control of markup and styling |
| Bryntum Grid | Commercial | Yes, rows | Scheduling and project-style grids with heavy data |
Three Questions That Cut the List
Answer these in about a minute and most readers will land on one or two rows.
- Do you need grouping, pivoting or Excel export out of the box? If yes, start with AG Grid or Bryntum Grid, and check the tier immediately. If no, react-data-grid and TanStack Table stay credible.
- Will the screen show more than a few thousand rows at once? If yes, favour built-in row and column virtualisation from AG Grid or MUI X Data Grid. With TanStack Table, you’ll add and test a virtualiser yourself.
- Does the team already use MUI, or does it want to own every piece of markup? An existing MUI system points to MUI X Data Grid. A team that wants full control of markup, styles, and semantics points to TanStack Table, provided it accepts the build cost.
Treat the table as a starting point, not a verdict. A library can look right here and still lose on focus retention after filtering, on a licence clause tied to a roadmap feature, or on scroll performance with your column types. The sections that follow test each candidate against performance, accessibility, features, and cost, in that order of risk.
How the Main React Data Grid Libraries Are Built
Architecture decides what your team maintains. The same column definition can hide very different amounts of rendering, keyboard handling, and state management.
Three Models, Three Maintenance Bills
Full-featured grids such as AG Grid, MUI X Data Grid, and Bryntum Grid ship rendering, state, editing, and styling together. Delivery is faster because sorting menus, editors, and pagination already exist. The cost is dependence on the library’s API and theme system, and upgrades can break overrides you’ve layered on top.
Headless logic libraries such as TanStack Table return state and row models and leave markup to you. You gain full control and usually a smaller bundle. You also build virtualisation, keyboard handling, and ARIA roles yourself, or you assemble them from other packages and own the seams.
Lightweight grids such as react-data-grid sit between those poles. They cover common cases without a large feature set. That restraint suits simple internal tools, but it becomes a limit when product asks for grouping, complex editors, or server-driven behaviour the library wasn’t designed around.
A headless library hands you every accessibility decision you do not make.
State and Rendering Boundaries in React
Decide early whether sort, filter, and selection are controlled by React state or held inside the grid. Controlled state makes deep links, saved views, and server requests easier to reason about. Internal state is quicker to wire up, but it can fight routers, forms, and server-state libraries later.
Grids also use browser APIs for measurement, scrolling, and focus. In frameworks that render on the server, that means the grid belongs in a client component with a clear boundary. Check that boundary before adding a grid to a route, not after hydration errors appear in staging.
Say a support team lifts sort and filter into server requests. The browser holds one page of tickets, the grid stays light, and a headless or lightweight option may be enough. Say the same team keeps every ticket in memory for instant local filtering. Now virtualisation, column virtualisation for wide rows, and careful memoisation matter far more. The data flow, not the logo on the library, decides which architecture fits.
Performance and Virtualisation Trade-offs at Scale
Rendering mode determines how many elements the browser must manage. Compare the options in this overview of data grids before you benchmark individual libraries, because the mode often matters more than the vendor.
| Mode | Elements rendered | Strength | Main risk |
|---|---|---|---|
| Virtualised scrolling | Only visible rows and columns | Fast on very large datasets | Off-screen rows missing from the DOM; find-in-page and some assistive technology may miss them |
| Paginated rendering | One page of rows | Predictable and simple to audit | Users switch pages; scrolling feels less continuous |
| Full DOM, no virtualisation | Every row | Simplest integration | Heavy memory and render cost once row counts reach the thousands |
Practical Size Thresholds
Below a few hundred rows, any mode works and you should optimise for clarity. From several thousand rows, virtualisation keeps memory and render cost stable because only the viewport, plus a small overscan buffer, reaches the DOM. At tens of thousands of rows, pagination or server-side queries often give more predictable behaviour than pushing ever more data through client-side virtualisation.
That guidance aligns with the UK Government Digital Service digital standard, which frames performance and accessibility as linked service concerns. For accessible deployments, pagination is the safer baseline because it limits rendered elements and lets you disable virtualisation for the visible page. Disabling virtualisation entirely on a huge dataset does the opposite. It increases DOM size, memory use, and rendering cost.
Virtualisation has costs you won’t see in a frame-rate graph. Rows off screen are missing from the DOM, so browser find-in-page, printing, and some assistive technologies can miss them. Rapid scrolling can also produce blank rows if the overscan value is too small, while a large overscan brings back the DOM cost you tried to avoid.
Run a Fair Benchmark
Use the same dataset, browser, and device class for each candidate. Measure initial render time, scroll or pagination responsiveness, heap growth, long tasks during scroll, and keyboard interaction latency after sorting. Test on a throttled mobile network and a lower-powered device as well as your development machine, because a fast laptop overstates what many UK users on older phones will experience.
Read the results as a set. A grid that wins on initial render but creates long tasks during scroll will feel slower to users who explore the data. A slightly slower first paint with stable scrolling and predictable keyboard response is usually the better production trade.
The fastest benchmark is rarely the right production choice, because it measures a dataset that never changes shape.
Switch to server-side queries or pagination when the data is personal or commercially sensitive and shouldn’t sit in browser memory. Make the same switch when row count keeps growing beyond what the device can hold, or when users need to query the full dataset rather than a window of it. Reducing transferred data often beats increasing raw rendering throughput.
Editing, Filtering and Export Features Compared
Feature checklists hide the details that break in production. Use the matrix to shortlist, then test the behaviour behind each tick. Confirm every cell against current vendor documentation before you commit a design.
| Library | Inline editing | Row grouping | Export | Server-side data |
|---|---|---|---|---|
| AG Grid | Yes | Yes, Enterprise tier | Yes, CSV and Excel | Yes |
| MUI X Data Grid | Yes | Yes, Pro tier | CSV included; check Excel tier | Yes |
| react-data-grid | Yes | Yes, built-in grouping | CSV through custom code | Build request handling yourself |
| TanStack Table | Build it yourself | Built-in grouping API | Build it yourself | Build it yourself |
| Bryntum Grid | Yes | Yes | Yes, Excel export | Yes |
Editing Is a Keyboard Contract
Inline editing needs validation, an undo path, and a keyboard model for editable cells. Check whether Enter and Escape commit or cancel, whether invalid values block navigation, and whether focus returns to the cell afterwards. An editor that works with a mouse but traps or loses keyboard focus isn’t finished.
Our own benchmark for this behaviour is straightforward. The Data Grid supports inline editing with validation and undo, has typed filters, multi-sort, virtual rows and server queries, and exports to CSV and typed .xlsx. Whatever library you choose, write those expectations into your test plan rather than assuming the demo covers them.
Filters, Grouping, and the Server Boundary
Typed filters per column are the fastest for users to understand. Custom filter interfaces can be more powerful, but they need their own accessible labels, error handling, and clear reset behaviour. Test both with real values, especially dates and formatted numbers, because parsing costs often appear there first.
Row grouping with aggregates such as sums, averages, and totals is often a paid feature in commercial grids. Check the tier before design settles. A finance table that needs grouped totals and Excel export may rule out a free-only setup on day one, however good the core grid feels.
Server-side sorting, filtering, and paging matter once the dataset lives on the server. Confirm the grid sends the request parameters you need, handles loading and empty states, and recovers cleanly after a failed request. For export, CSV is simple. Excel output, especially typed cells and retained formatting, may need a paid tier or a separate package.
Accessibility Requirements and How to Test a Grid
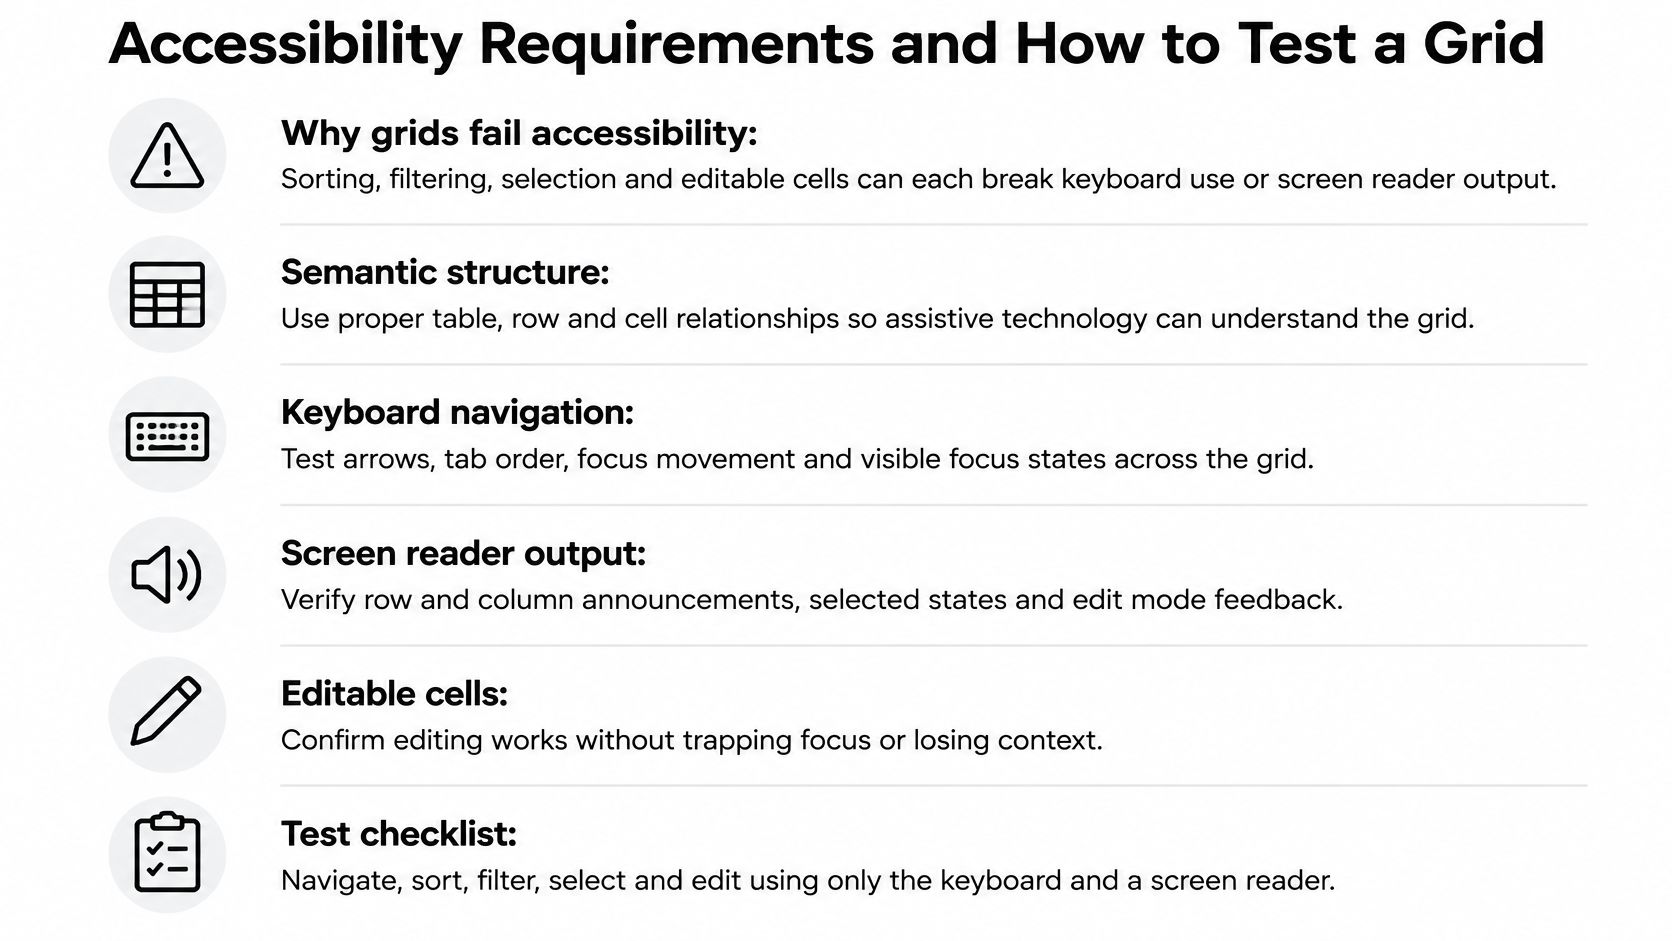
Grids are a common accessibility gap because they combine sorting, filtering, pagination, selection, and interactive cells in one dense control. Each interaction can break keyboard use or screen reader output. UK government research captured in the accessibility data tables for private-sector products and services found that 26% of disabled respondents identified technology as one of the least accessible sectors. A polished grid that excludes those users has not solved the problem.
For UK public-sector services, this is also a legal duty. The GOV.UK accessibility requirements guidance explains that the Public Sector Bodies Accessibility Regulations 2018 came into force on 23 September 2018 and require sites and apps to meet accessibility standards and publish an accessibility statement. Treat WCAG 2.2 AA conformance and statement evidence as acceptance criteria, and use a structured WCAG compliance checklist to record the results.
Semantics and Focus Behaviour
Use grid or table roles correctly, set row and column headers, and use aria-sort to announce sort state. When rows are virtualised, set aria-rowcount and aria-rowindex so screen readers know the full size of the dataset. Without those values, a user may hear a small window described as the whole result set.
Focus must stay on the control the user acted on after a sort, filter, or page change. Cells should use a roving tabindex so the grid is a single tab stop, with arrow keys moving inside it. Announce result counts and sort changes politely, and don’t move focus to the top of the page just because data refreshed.
A Six-Step Audit You Can Repeat
- Complete the main task with the keyboard only. Use the keyboard to sort, filter, select, and edit without touching a mouse.
- Run a screen reader pass. Test NVDA with Firefox, JAWS with Chrome, and VoiceOver with Safari.
- Sort and filter, then check announcements and focus. Confirm result counts, sort state, and focus retention are correct.
- Zoom to 200 per cent and check reflow. Headers, editors, and menus must remain usable without clipped content.
- Turn on reduced motion and check animations. Row updates and loading indicators shouldn’t rely on motion alone.
- Record the results as evidence. Keep defects, workarounds, and retest dates for the accessibility statement.
A grid that is fast but cannot be operated with a keyboard has failed the task.
Where a dashboard grid can’t be made fully accessible, publish the underlying data as a plain HTML table or CSV download alongside it. The UK Analysis Function dashboard guidance recommends making underlying data available in another form because dashboards frequently fail full accessibility requirements. That fallback isn’t an admission of defeat. It’s an auditable route to the same information.
Bundle Size, Licensing and Integration Costs
The purchase price is only one cost. Bundle weight, theme maintenance, and data governance follow the grid for its whole life.
The image below frames the first decision many teams face, a free core against a commercial tier that provides roadmap features.

Licence Triggers to Check in Writing
MIT-licensed libraries have no per-seat fee. Several commercial libraries move grouping, pivoting, or Excel export behind a paid tier, and some charge per developer or per application. Ask whether the price changes with the number of applications or developers, and whether the tier covers features on the next twelve months of your roadmap.
Check licence obligations beyond price, too. If you evaluate copyleft components or combine libraries in a distributed product, Loupe’s guide to source-sharing duties under AGPL is a useful starting point for the questions your legal reviewer will ask. Confirm the answer before procurement, not during release week.
Bundle, Styling, and Integration Work
Tree-shaking only ships the modules your app imports, so import the grid and the features you use, then measure with a bundle analyser. Compare gzipped sizes, not vendor claims. Virtualisation adds JavaScript but reduces DOM size, so judge it with runtime measures alongside download weight.
Styling costs cut both ways. A headless library requires your team to build and maintain its own styles. A full-featured library needs theme overrides that can break on upgrades. Check integration with forms, routers, server-state libraries such as TanStack Query, and component tests before you estimate delivery.
The walkthrough below is useful while you price that integration work, especially for spotting where configuration ends and custom code begins.
Say a team pairs a headless table with TanStack Query. It may spend more time on styling and keyboard behaviour, but it gets a smaller bundle and full control over data flow. Add data governance to the estimate as well. Confirm which rows and columns reach the browser, whether server-side mode keeps sensitive fields off the client, and whether export writes personal or commercially sensitive data into files that need controlling, redaction, or audit logging.
Confirm Your Shortlist Before You Commit
Match the shortlist to the situation. Enterprise features and Excel export point to AG Grid or Bryntum Grid, a team already on MUI points to MUI X Data Grid, control and small bundles point to TanStack Table, and simple needs point to react-data-grid.
Confirm that shortlist with a gated test, using a feature comparison matrix to record pass or fail rather than impressions.
- Build a spike with real data at the production row count.
- Run the rendering benchmark on a throttled network and a lower-powered device.
- Run the six-step accessibility audit and record the results.
- Check the licence tier against the next twelve months, including per-developer or per-application fees.
- Estimate gzipped size with a bundle analyser.
- Check sensitive data exposure in the browser and in exported files.
Drop any candidate that fails a gate, then compare survivors on styling and maintenance cost. Run the spike, the audit, and the licence check, in that order, before your team signs a contract.
If you’re building data-heavy interfaces and want grid behaviour, accessible primitives, and theming in one system, explore what DOM Studio offers for production teams. Visit DOM Studio to browse the component catalogue and see how its data components fit your next React Data Grid decision.